 for a graph in a graph pad or for a table in a table pad that has been defined as a comparative graph or table.
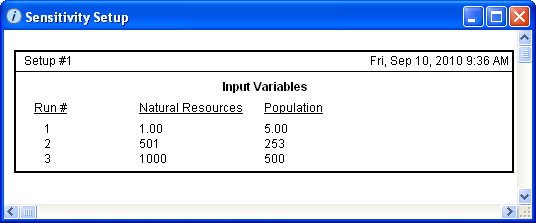
 The Sensitivity Setup window displays a journal of the most recent sensitivity analysis setup. For each run, the journal displays the value for each included entity, and the date and time of the most recent run.
To open this window, click  for a graph in a graph pad or for a table in a table pad that has been defined as a comparative graph or table.
